

Everything on a map is there for a reason.
We forget this sometimes. We get absorbed in the work of navigating from one place to another or simply distracted by the interactive features built into the maps we encounter online. But every once in a while we notice that something is missing—a road, a bog, a boundary—and the absence of that feature prompts us to look again at what is there on the map, to identify the other absences, and to wonder about the balance.
In the classes I teach, it doesn’t take long for a perceptive student to propose that the decisions to include or exclude pieces of geospatial information from the surface of any given map are political or ideological. Oftentimes they are. But cartographers will tell you that politics is not the sole determinant of their craft: mapmaking turns on the principles of design and the constraints of technology. They will also tell you that a map is the graphic expression of a thousand decisions—an “elaborate network of dependencies” linking color, line, symbol, space, and meaning.
And then there are atlases.
If you think of a bound collection of maps when you hear the word “atlas,” you owe that association to a famous cartographer from Flanders. Gerardus Mercator (1512–1594) considered the pre-Olympian god Atlas a great geographer and invoked him to name a groundbreaking compilation of treatise and maps. This was a slightly roguish interpretation: the Greeks had known Atlas as a great astronomer, not a great geographer, and as the bearer of the celestial, not the terrestrial, world. But Mercator was the influencer of his day and so, from the late sixteenth century onward, the world has learned to expect to find maps—a great many maps, related by region or theme—when they open an atlas.
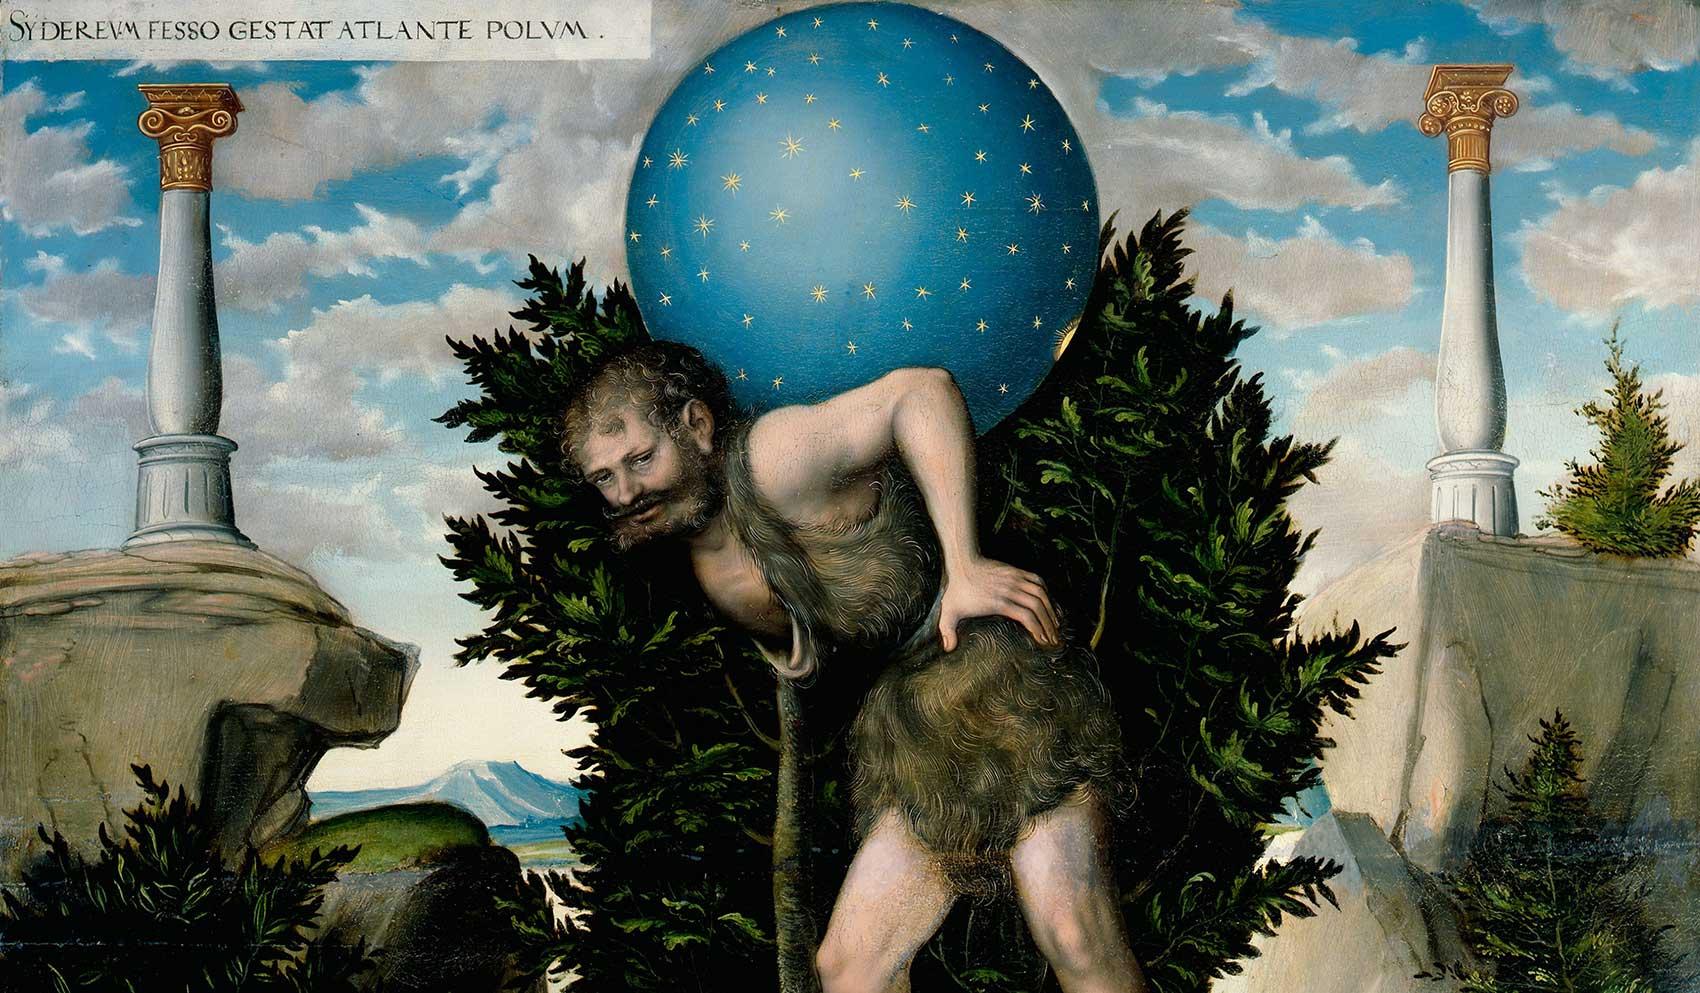
Detail from ‘Hercules and Atlas’ (after 1537) by Lucas Cranach the Elder showing Hercules relieving Atlas of his task.
Harvard’s Houghton Library is home to something called the Chorographic Atlas. Tsar Peter I commissioned it in January 1696 and an architect named Semyon Ul’yanovich Remezov, who painted icons and fought battles against local nomads in his spare time, created it (along with two other manuscript versions). It is a bound set of manuscript maps of Siberia and it is spectacularly beautiful.
The Atlas contains 163 maps along with dozens of pages of text. Some pages have neat fold-outs for town plans or river courses. On others the content spills exuberantly to the very edge. There are erasures and smudges and tears—all the markings you would expect from an object that is three centuries old. Remezov left a few pages completely blank and he was hasty with some of the maps. But the catalog of features he chose to include in the atlas is astounding. There are 6,091 tree symbols and over 27,000 miles of rivers. There are marshy hummocks and oxbows and portages, salt lakes, arctic foxes, and burial mounds. Fishing huts and fortified settlements dot the landscape. Ominous notes warn against poisonous berries and treacherous rapids, and careful notes shed light on how long it takes to move from one location to another via dogsled or boat. It is a unique geospatial archive of seventeenth-century Siberia.
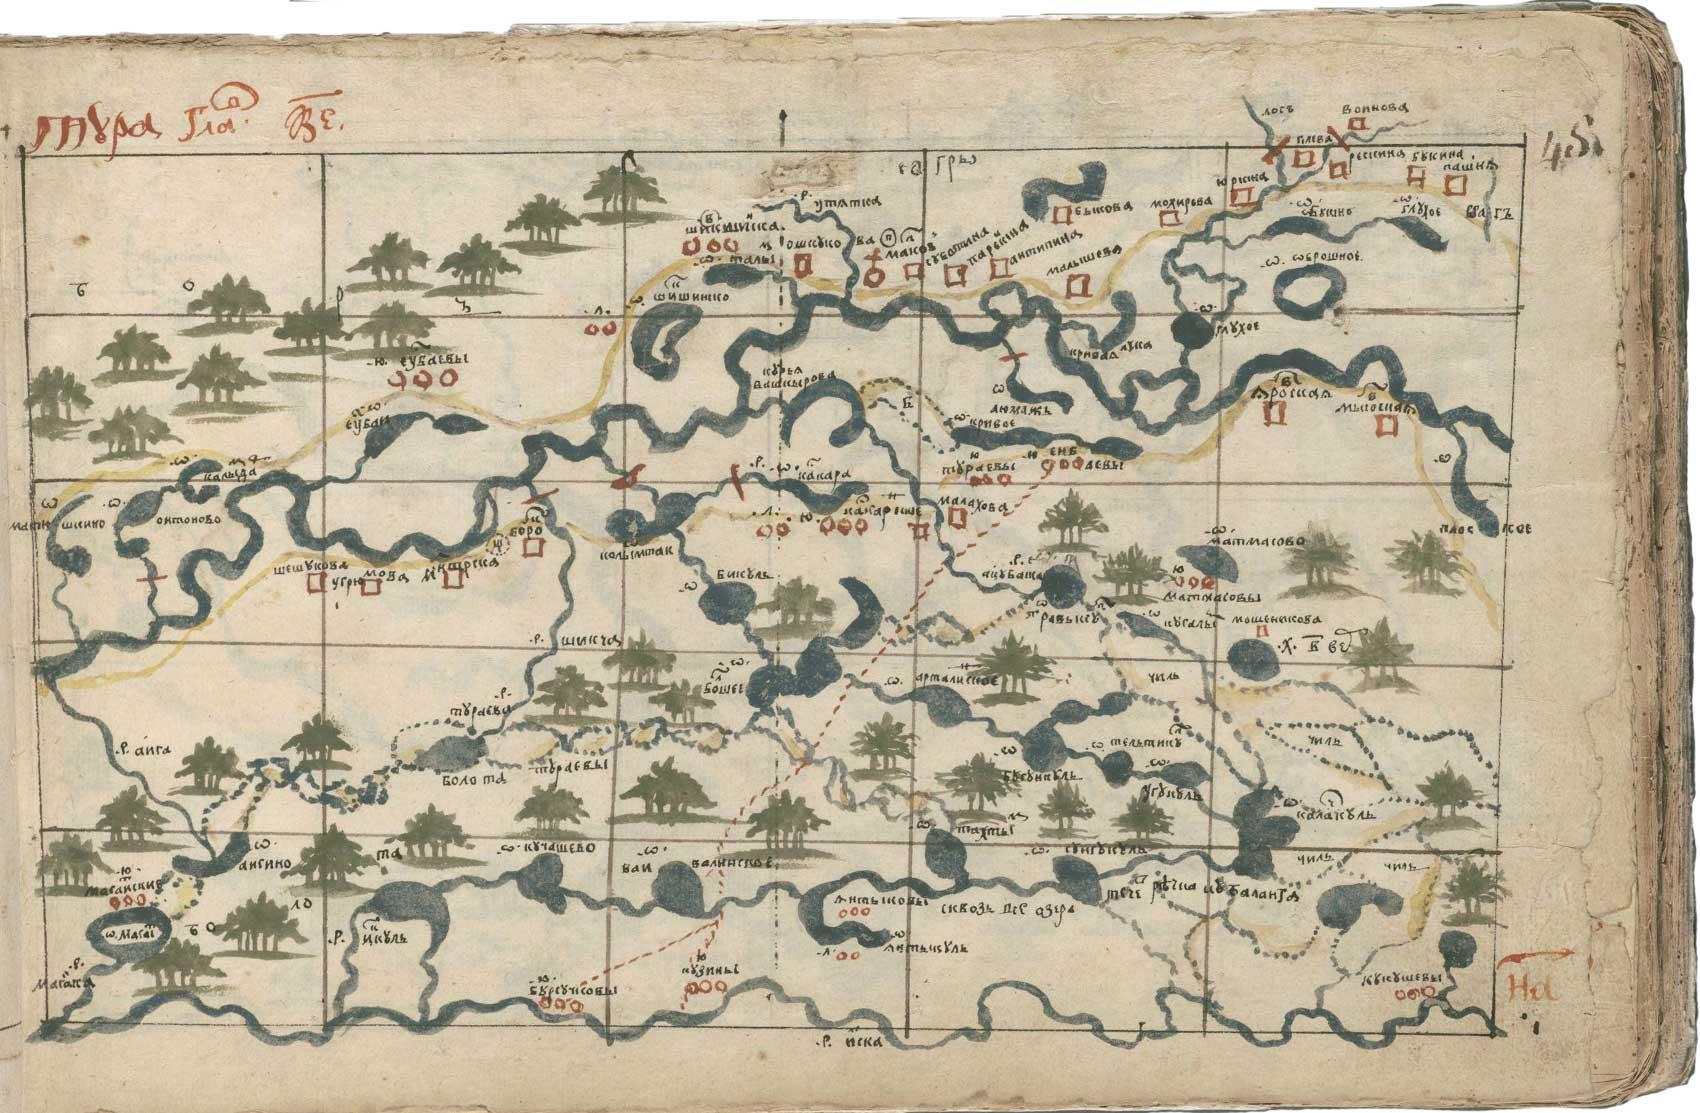
Folio 48 of the Chorographic Atlas (1696) showing part of the Tura River.
There is nothing quite like the Chorographic Atlas in the history of Russian cartography.In addition to the Chorographic Atlas, Remezov produced two other versions of the Siberia atlas: the Sluzhebnaya kniga (Service Atlas) and the Chertezhnaya kniga (Atlas of Maps). A handful of historians have studied it, and skilled librarians transformed it from singular, delicate, artifact into public digital object. (Click here to access the high-resolution version.) Yet Remezov’s work lingers on the edge of obscurity.
In a way this is not terribly surprising. Many of the text notes are tough-to-decipher Old Church Slavonic abbreviations. Remezov did not use a coordinate grid. Nor did he use a consistent orientation: south is often at the “top” of the page, but not always. He arranged the maps in upriver sequence on some occasions and downriver on others. Scale varies from map to map, and even within the space of a single map. Scores of placenames have changed or been lost over time, leaving few unambiguous anchors to geographic space.
But what if there were a way to make sense of it all? What if there were a way to translate the wealth of information embedded in the atlas from a (beautiful) scramble of graphic symbols and disjointed texts into a coherent set of statements? What if we could more easily extract what Remezov wanted Tsar Peter the Great to know? What if we could figure out what the atlas says about the distribution of forests along the Irtysh River or about the location of fisheries or monasteries? And what if there were a way to put this body of geospatial information into conversation with modern data? Might we be able to compare the terrain and hydrology of Siberia then and now? Might we be able to determine whether the lakes on the map are still there or whether the nomadic settlements have become cities?
These days we have algorithms predicting global shipping patterns and choosing our playlists. We can have meetings with colleagues in multiple time zones and use satellites to monitor seasonal animal migrations. Technology makes anything possible. How hard could it be to crack the code of one rather diminutive atlas?
Over the next few months we will attempt to answer that question. We will share the lessons we have learned and give you a front-row seat for what has become a multi-year voyage into the world of digital scholarship. The voyage has taken us into the treacherous waters of data modeling, georeferencing, and visualization design. Our most valuable tools remain old standbys—deep disciplinary knowledge, regional expertise, and the ability to approach sources critically. But adopting an integrated research method changes everything: not just what we see on the map, but what we seek in the first place.
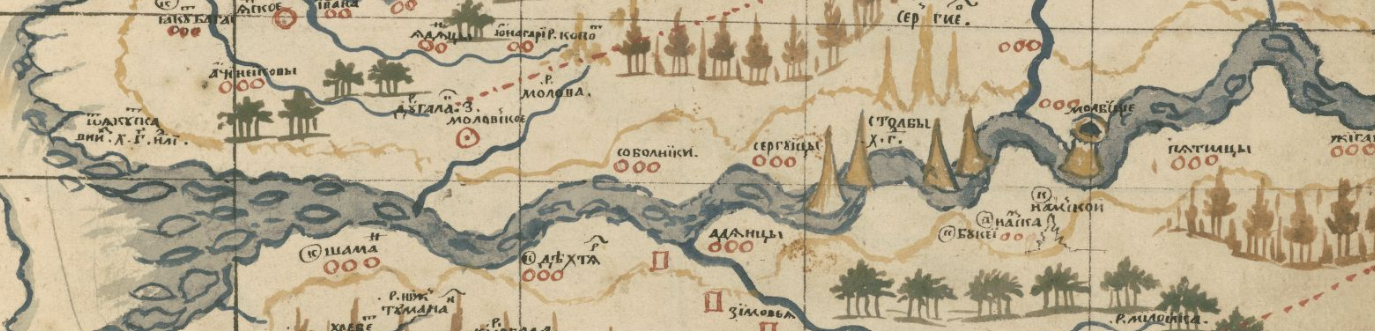
Part of the course of the Lena River.
Lesson #1: Pencils work in outer space (and in Siberia).
A primary goal of what we call the “Siberian Sketchbook” project is to create a database of the atlas’s contents. This sort of work involves building an inventory of each feature and defining the relationships among those features. In a GIS environment, the key relationship is generally spatial: if I know the location of each feature, I can establish distance, density, adjacency, hierarchies, etc. I can identify the villages on the left bank of the Tobol River or the salt lakes within twenty kilometers of a caravan route. But it isn’t easy to establish location for the features on the Atlas—that is a project in and of itself (and more on that in a later post). It is much easier to make a list of maps and a list of features, and then connect one list to the other. I worked along those lines briefly, but began to worry that capturing data at the level of the map would not allow me to analyze patterns with any reasonable amount of accuracy.
You can’t go very far into a research project without determining the core unit of analysis. I wasn’t there yet. I needed a middle ground between feature-level location and map-level generalization. I pondered the problem. I searched up comparable projects and combed through help guides. I failed. Again and again.
Failure stories can be fun. According to one of the oldest failure stories on social media, in the 1960s NASA spent $165 million developing a writing implement that would work in zero-gravity, at any temperature, and on any surface... while the Soviets sent cosmonauts into space armed with pencils. It’s an amusing and believable story, but not a true one. The real story is that NASA sent its astronauts into space with pencils too, though with increasing concern about the flammable nature of an otherwise attractive solution. NASA did not pay to solve this particular problem. Instead, Paul C. Fischer and his Fischer Pen Company invested and eventually invented a pressurized ink cartridge. The Fischer “Space Pen” is still in use, but the most obvious solution—the pencil—bridged the gap.
Pulling off the Sketchbook project will require inventing our own version of the Space Pen. Meanwhile, all I needed was a (figurative) pencil.
I found one, right there in plain sight. It was the tool Remezov himself used to produce his atlas: his drafting grid. Remezov divided the space of each map into five neatly-ruled columns and five neatly-ruled rows. And perhaps because he never brought the Chorographic Atlas before the tsar, he did not bother to mask the lines. Suddenly, instead of 163 maps, I had 4,075 grid-squares to work with. I could identify relationships between features with a much greater degree of accuracy.
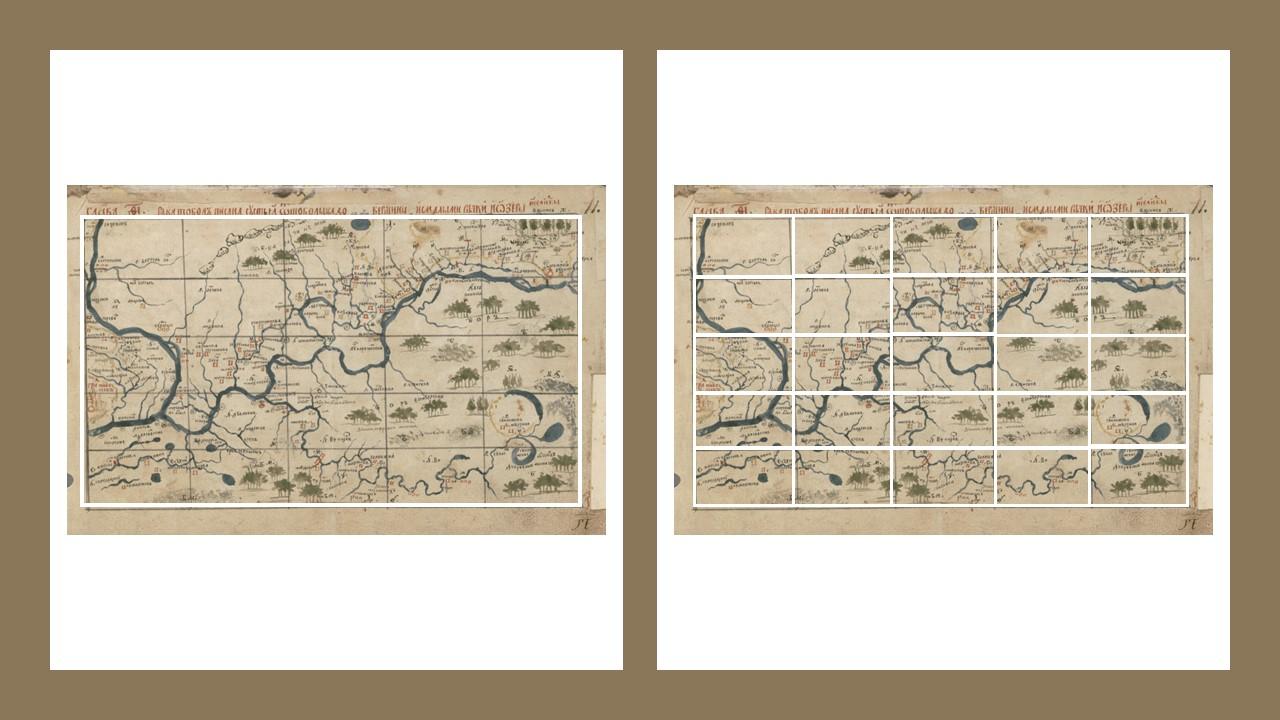
Folio 11 of the Chorographic Atlas showing part of the Tobol River. The white grid overlays show the difference in accuracy between grid-squares and the map itself.
So began the real work of coding over 15,000 features: oak groves, ravines, rocky knolls, cemeteries, freshwater springs, ploughed fields, and thickets—there are 131 different feature types on the maps. They are painted onto the pages in a consistent palette of blue, green, yellow, and red. Many cross from one grid-square to another. Some, like the forest, occur with high frequency; others, like the pearl farm along the Angara River, are utterly unique.
None exists in isolation. We are hard at work establishing their graphic and geospatial relationships as well as their historical context. There are obstacles ahead and we are working "in pencil," but that is good enough for now.
To be continued.

Director of Graduate Studies, REECA Program, and Director, Imperiia Project, Davis Center
